
3 Advanced Lead Generation Tactics for Property Developers
January 14, 2020
Working With Waypost: The First 90 Days
January 28, 2020Google PageSpeed Insights (PSI) is a tool that was designed by Google to quickly test web site performance and offer suggestions for improving your web design and development, and it actually does a very good job of meeting that expectation. However, there are very few tools that have been more abused and misunderstood than this one.
Everybody wants a fast website, and you should because page speed is an important SEO factor, but before you allow your website’s PageSpeed Score to burrow into your brain and create doubt, fear, and paranoia, we need to set the record straight on what this score means and how this Google website speed test should be used.
What follows is a deeper dive (in layman’s terms) into the PageSpeed Score. If you don’t care to read all of it, I’ve condensed our response to any PageSpeed Score into a single sentence for your convenience:
There is no significant correlation between your PageSpeed Score and the actual speed of your website or your organic SERP rankings, but if you still have concerns we can have a qualified web developer take a look.
Breaking Down the Google PageSpeed Score
Lab Data vs. Field Data
Your Google PageSpeed Score is based on lab data generated from a single test load of your website. Google’s intention with this lab test is to show developers the specific bottlenecks that occurred for a simulated “average user”. If google were to average multiple lab tests together or if they were to consider field data (real-world user data) in the PageSpeed Score, the score would become disassociated from the technical issues that individual lab tests are meant to identify and report.
What this means is that PSI is not assigning a “speed” score to your website – they’re assigning a “grade” to a single lab test. To illustrate, I tested the same random website homepage 15 times within a 10 minute span. In that 10 minute span I received the following results for the mobile page speed test:
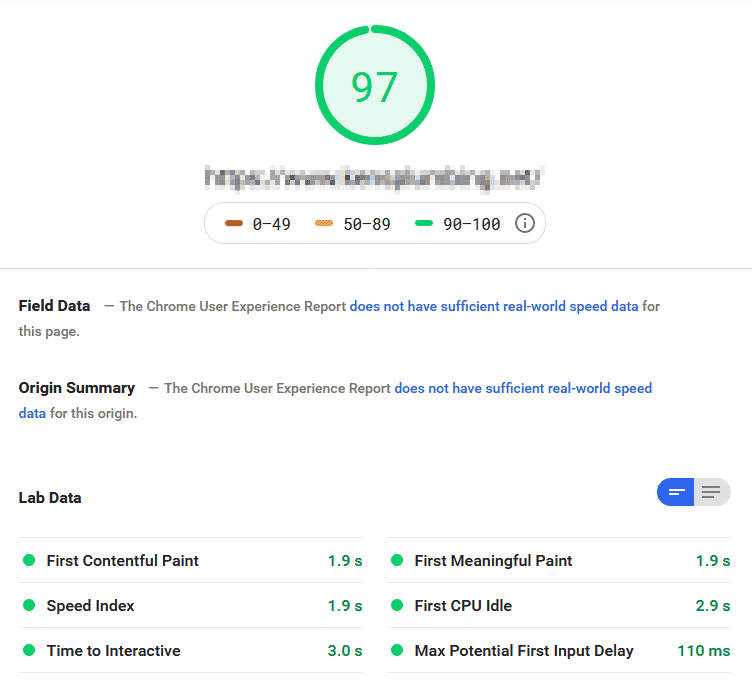
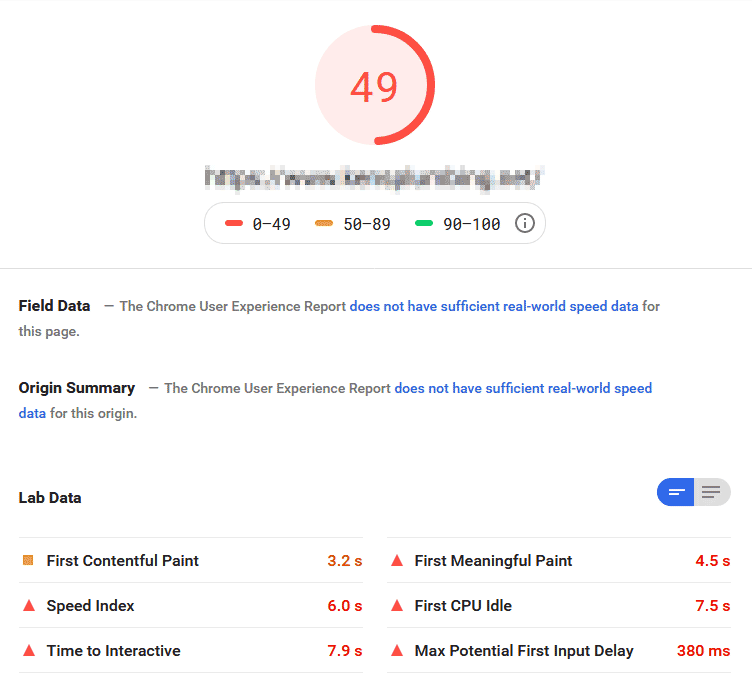
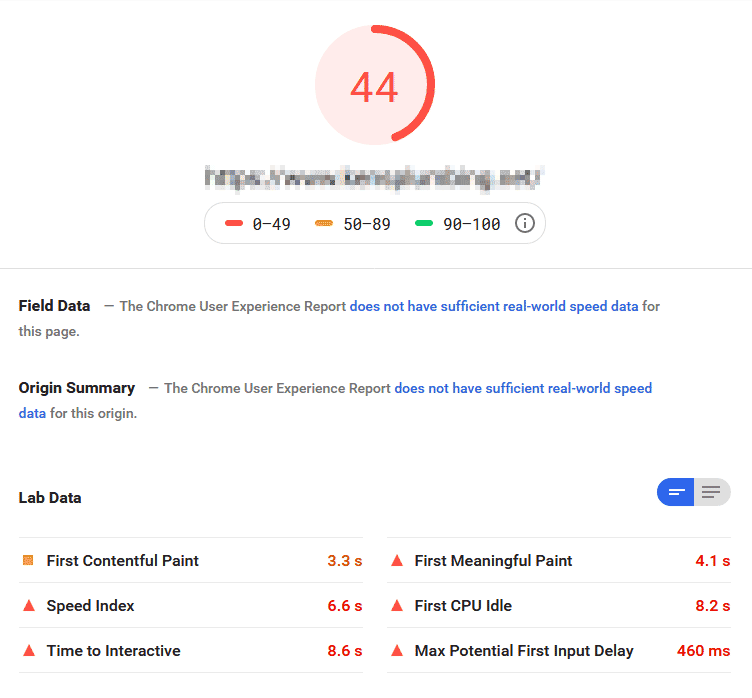
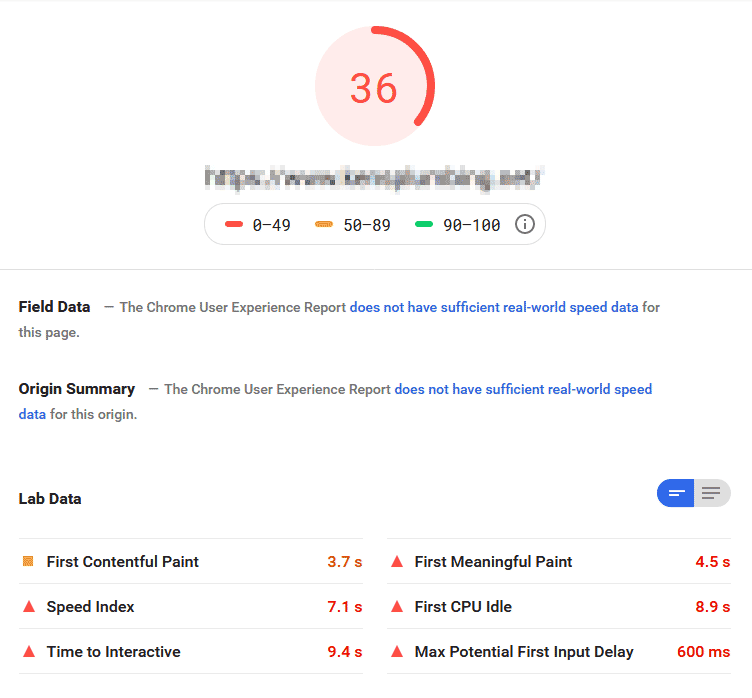
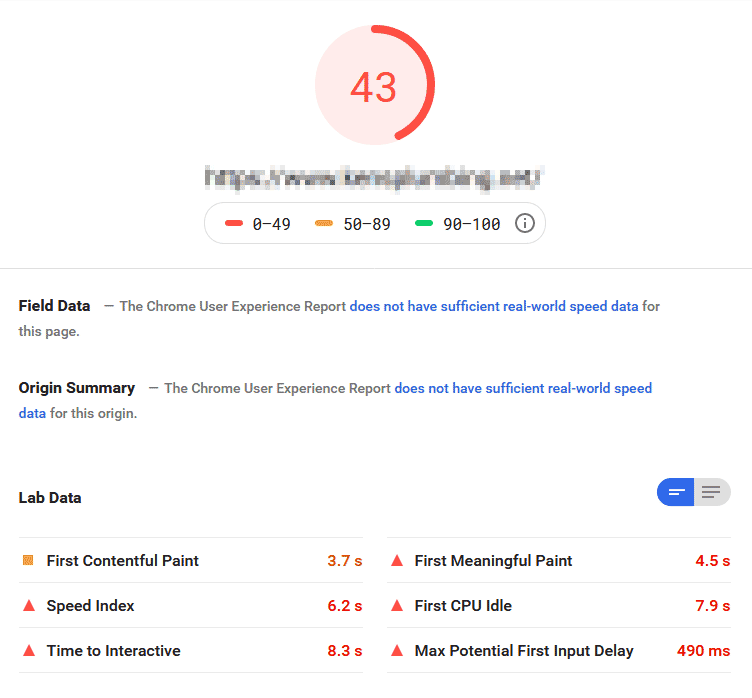
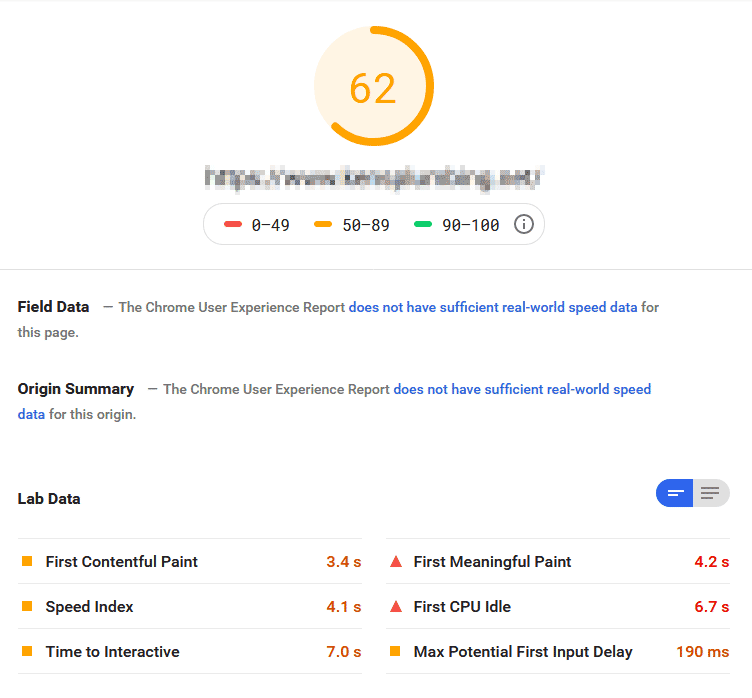
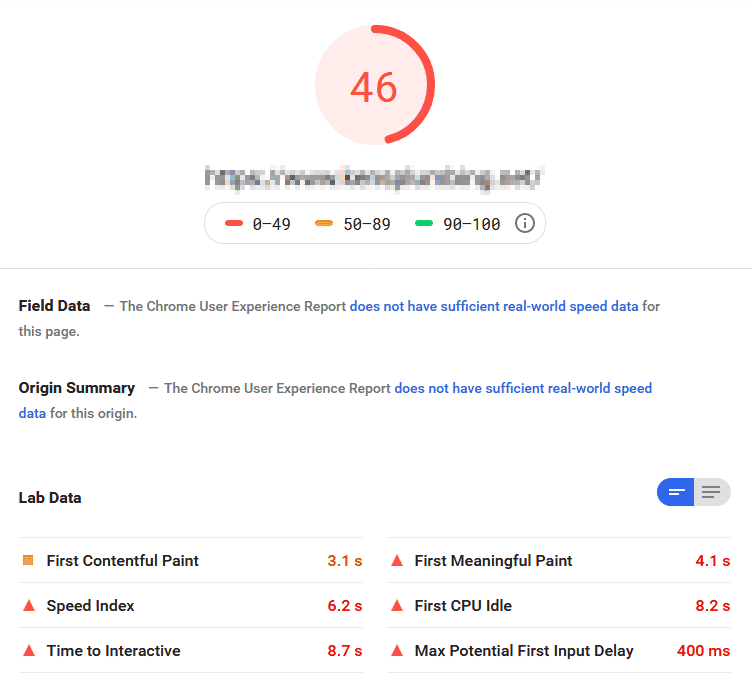
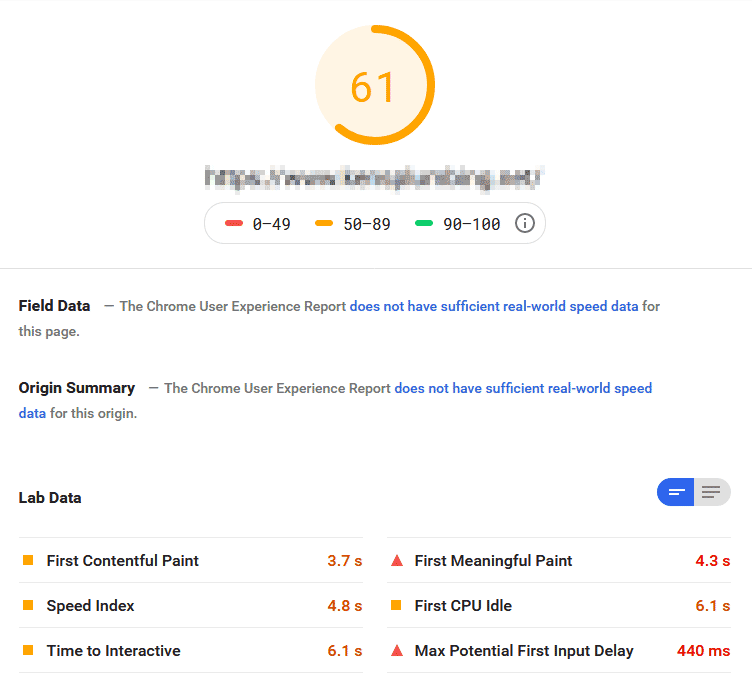
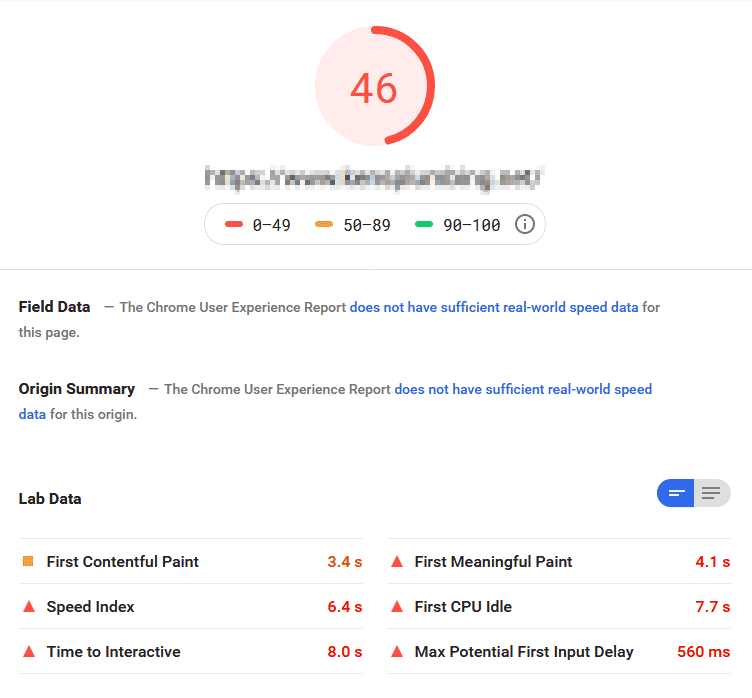
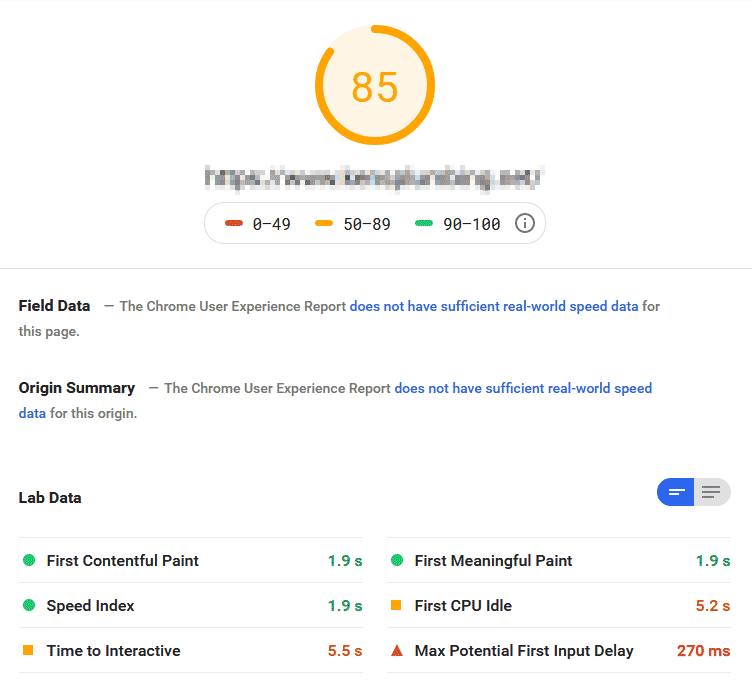
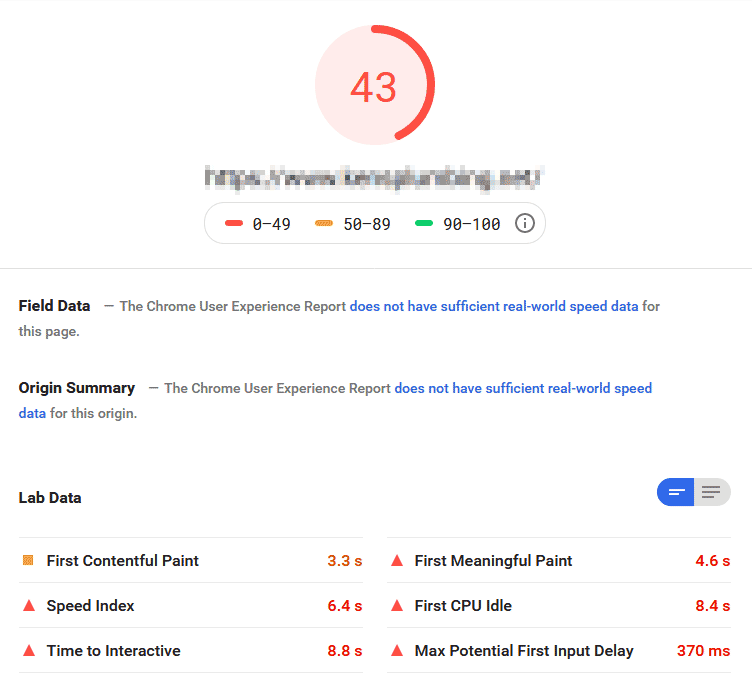
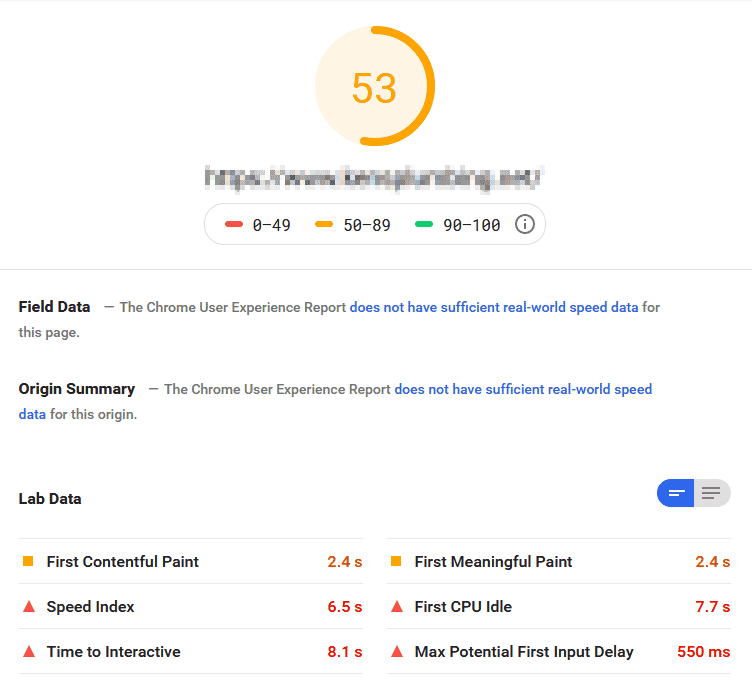
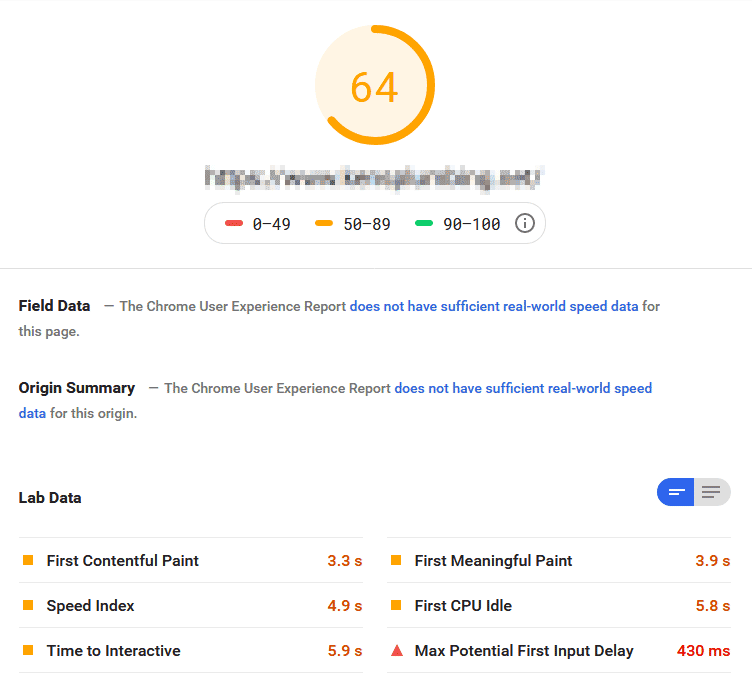
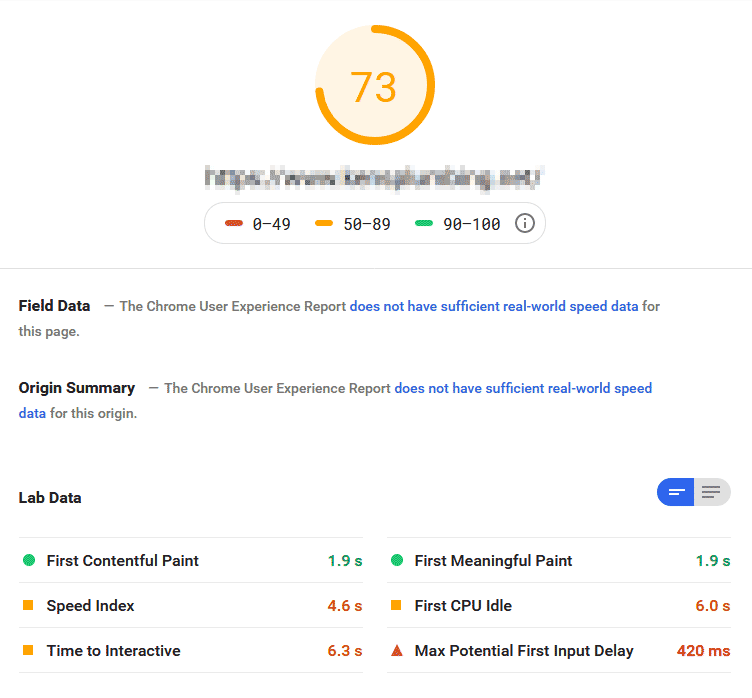
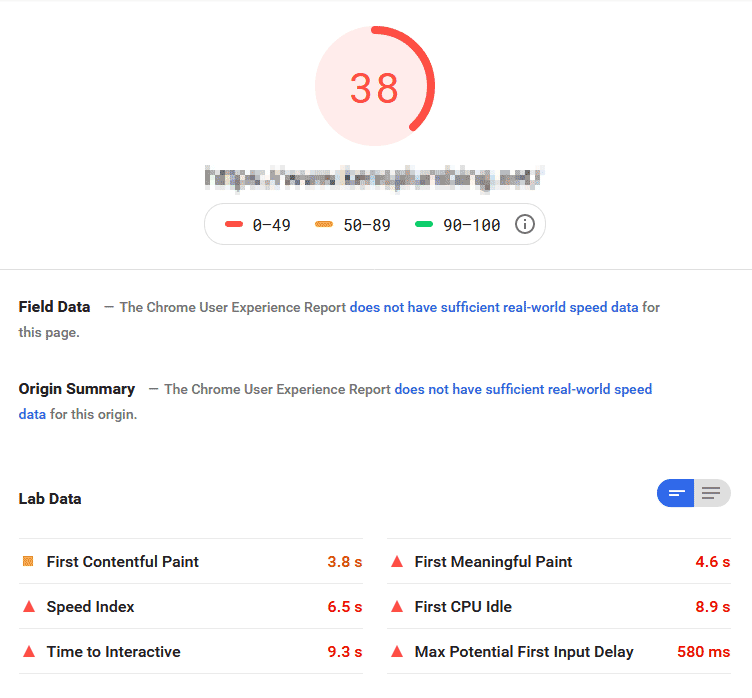
As you can see, it would be very easy for me to claim that this site scored a 97 and equally easy to claim that this site scored a 36, but neither statement would be 100% truthful. These lab test scores were never meant to be used as a definitive result for your website as a whole. If a client is interested in a definitive picture of their website’s performance, we need to consider real-world field data.
PSI does provide real-world field data for pages with enough monthly traffic. Typically, Google collects real-world data from 1% of users who have usage statistic reporting enabled. Most of our clients don’t record enough monthly traffic to show any field data in PSI. (The lowest number of monthly visits I’ve seen to generate field data is 20k.)
We do, however, have the option to gather this data in Google Analytics (GA). GA’s default setting is still to collect data on only 1% of visits, but Google allows us to manually increase this variable to 10%. In many cases, collecting data on a higher percentage of users is the only way to see a large enough sample size to come to a reliable conclusion.
The data that we collect through GA focuses on two key metrics – First Contentful Paint (FCP) and Time to Interactive (TTI) – and because we’re using GA to collect our data (instead of PSI), we have the ability to segment the data and see it in the context of all the analytics data we’re collecting.
This method of collecting field data on load times and user experience is many times more helpful and reliable for the purpose of understanding a website’s overall performance.
“Network-independent”
In past versions of the PSI documentation, Google was careful to note that PSI “only considers the network-independent aspects of page performance”. This meant that Google was only reporting factors tied directly to the architecture of the website (the quality of the code) – not the speed or reliability of the internet connection or the device that was loading the page.
The current version of the documentation (v5) has removed this statement because it’s not strictly true. It is true that the score generated by PSI is generally based on the efficiency of the site’s network-independent architecture (as measured by response/load times), but it seems that these performance metrics are greatly affected by network performance. So PSI is looking at the “network-independent” substance of the web page, but they are looking at it within a very limited “network-dependent” context.
To make things even more confusing, in addition to the real-world network bottlenecks that can occur randomly from test to test, Google PageSpeed Insights is also applying simulated throttling to the test in order to mimic the expected performance of a Moto G4 on a 3G network.
I understand that not everyone has access to the newest smartphone and a 5G network, but it’s worth pointing out that PSI is assigning scores based on the performance of a page on a 4-year-old, sub-$100 smartphone that’s connected to a network running 10x slower than 4G LTE and 100x slower than 5G.
Getting back to the test itself, in the experiment above I tested the same page multiple times. In the test that scored 97, PSI did not offer any development opportunities, but in the test that scored 36 PSI reported several significant development issues and offered suggestions for improvement:
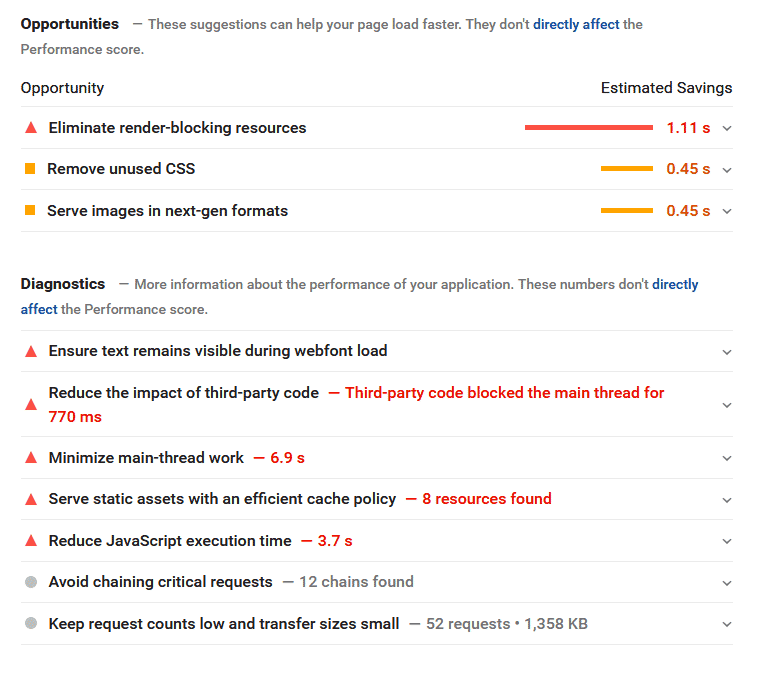
These suggestions are good suggestions for this page. Whether it scores a 97 or a 36, these opportunities would improve performance, but PSI only shows these opportunities after a slow test. This has led me to conclude that, as important as best practices are, the more important factors when it comes to site speed are network connection and hardware. Essentially even the bulkiest website can score 100 if the network is fast, and Google doesn’t seem to care about development issues if that’s the case.
Website Performance Best Practices
When it comes to developing a fast and reliable website, there are universally-acknowledged “best practices” that will generally produce a better user experience. Tools like PSI are designed to highlight these best practices and help developers identify ways to eliminate performance bottlenecks.
This list of suggestions that Google PageSpeed Insights provides, however, doesn’t come with a cost vs. benefit breakdown, and this can be confusing for people who don’t fully understand the meaning behind PSI’s suggestions. It is rare that a developer delivers a website that is perfectly optimized for speed – even if he were capable of doing so. In truth, the cost of delivering such a site would greatly outweigh any imaginable benefit.
While we do want to take advantage of every optimization possible, we have to weigh the cost of the optimization against the benefit that it would provide. And the cost of an optimization isn’t limited to a dollar amount. Other costs might include:
- Developing a custom CMS (or not using one at all)
- Limiting access to valuable code libraries and frameworks
- Limiting connections to third-party services (like HubSpot or Google Analytics)
It’s never worth it to reach the point that we begin to trade benefits or lose the ability to efficiently do the more important work (like your ongoing marketing and sales efforts).
A Single Metric
One of the biggest problems with using the PageSpeed Score as a metric is that the number doesn’t tell me anything useful. Whenever we design a metric, our goal is to measure the effect over time of the work that we’re performing. The value of the metric is that it’s directly correlated to the work.
In this sense, the PageSpeed Score isn’t a metric at all. Rather, it’s a grade on a random and chaotic test – a one time result based on more factors than anyone could possibly have control over. The value of this grade begins and ends in the mind of a capable developer who has the ability to interpret all of the accompanying data and act responsibly in the best interest of his client and that client’s users.
Conclusion
Google’s PageSpeed Insights is not a bad tool, but it is also not a tool for the benefit of the average business owner. Our approach as an SEO agency is to use PSI during the web design process as well as during periodic technical SEO audits. The feedback we receive from these tests is invaluable as we improve our development processes.
If you are interested in knowing more about your own PSI PageSpeed Score, talk to the company who built your website. If you’re one of our clients, we’ll be happy to review your results with you and explain the costs and benefits of improving your score. We’ll also be happy to show you the data that PSI doesn’t include in their tests and give you a full picture of the health and performance of your website. 


